

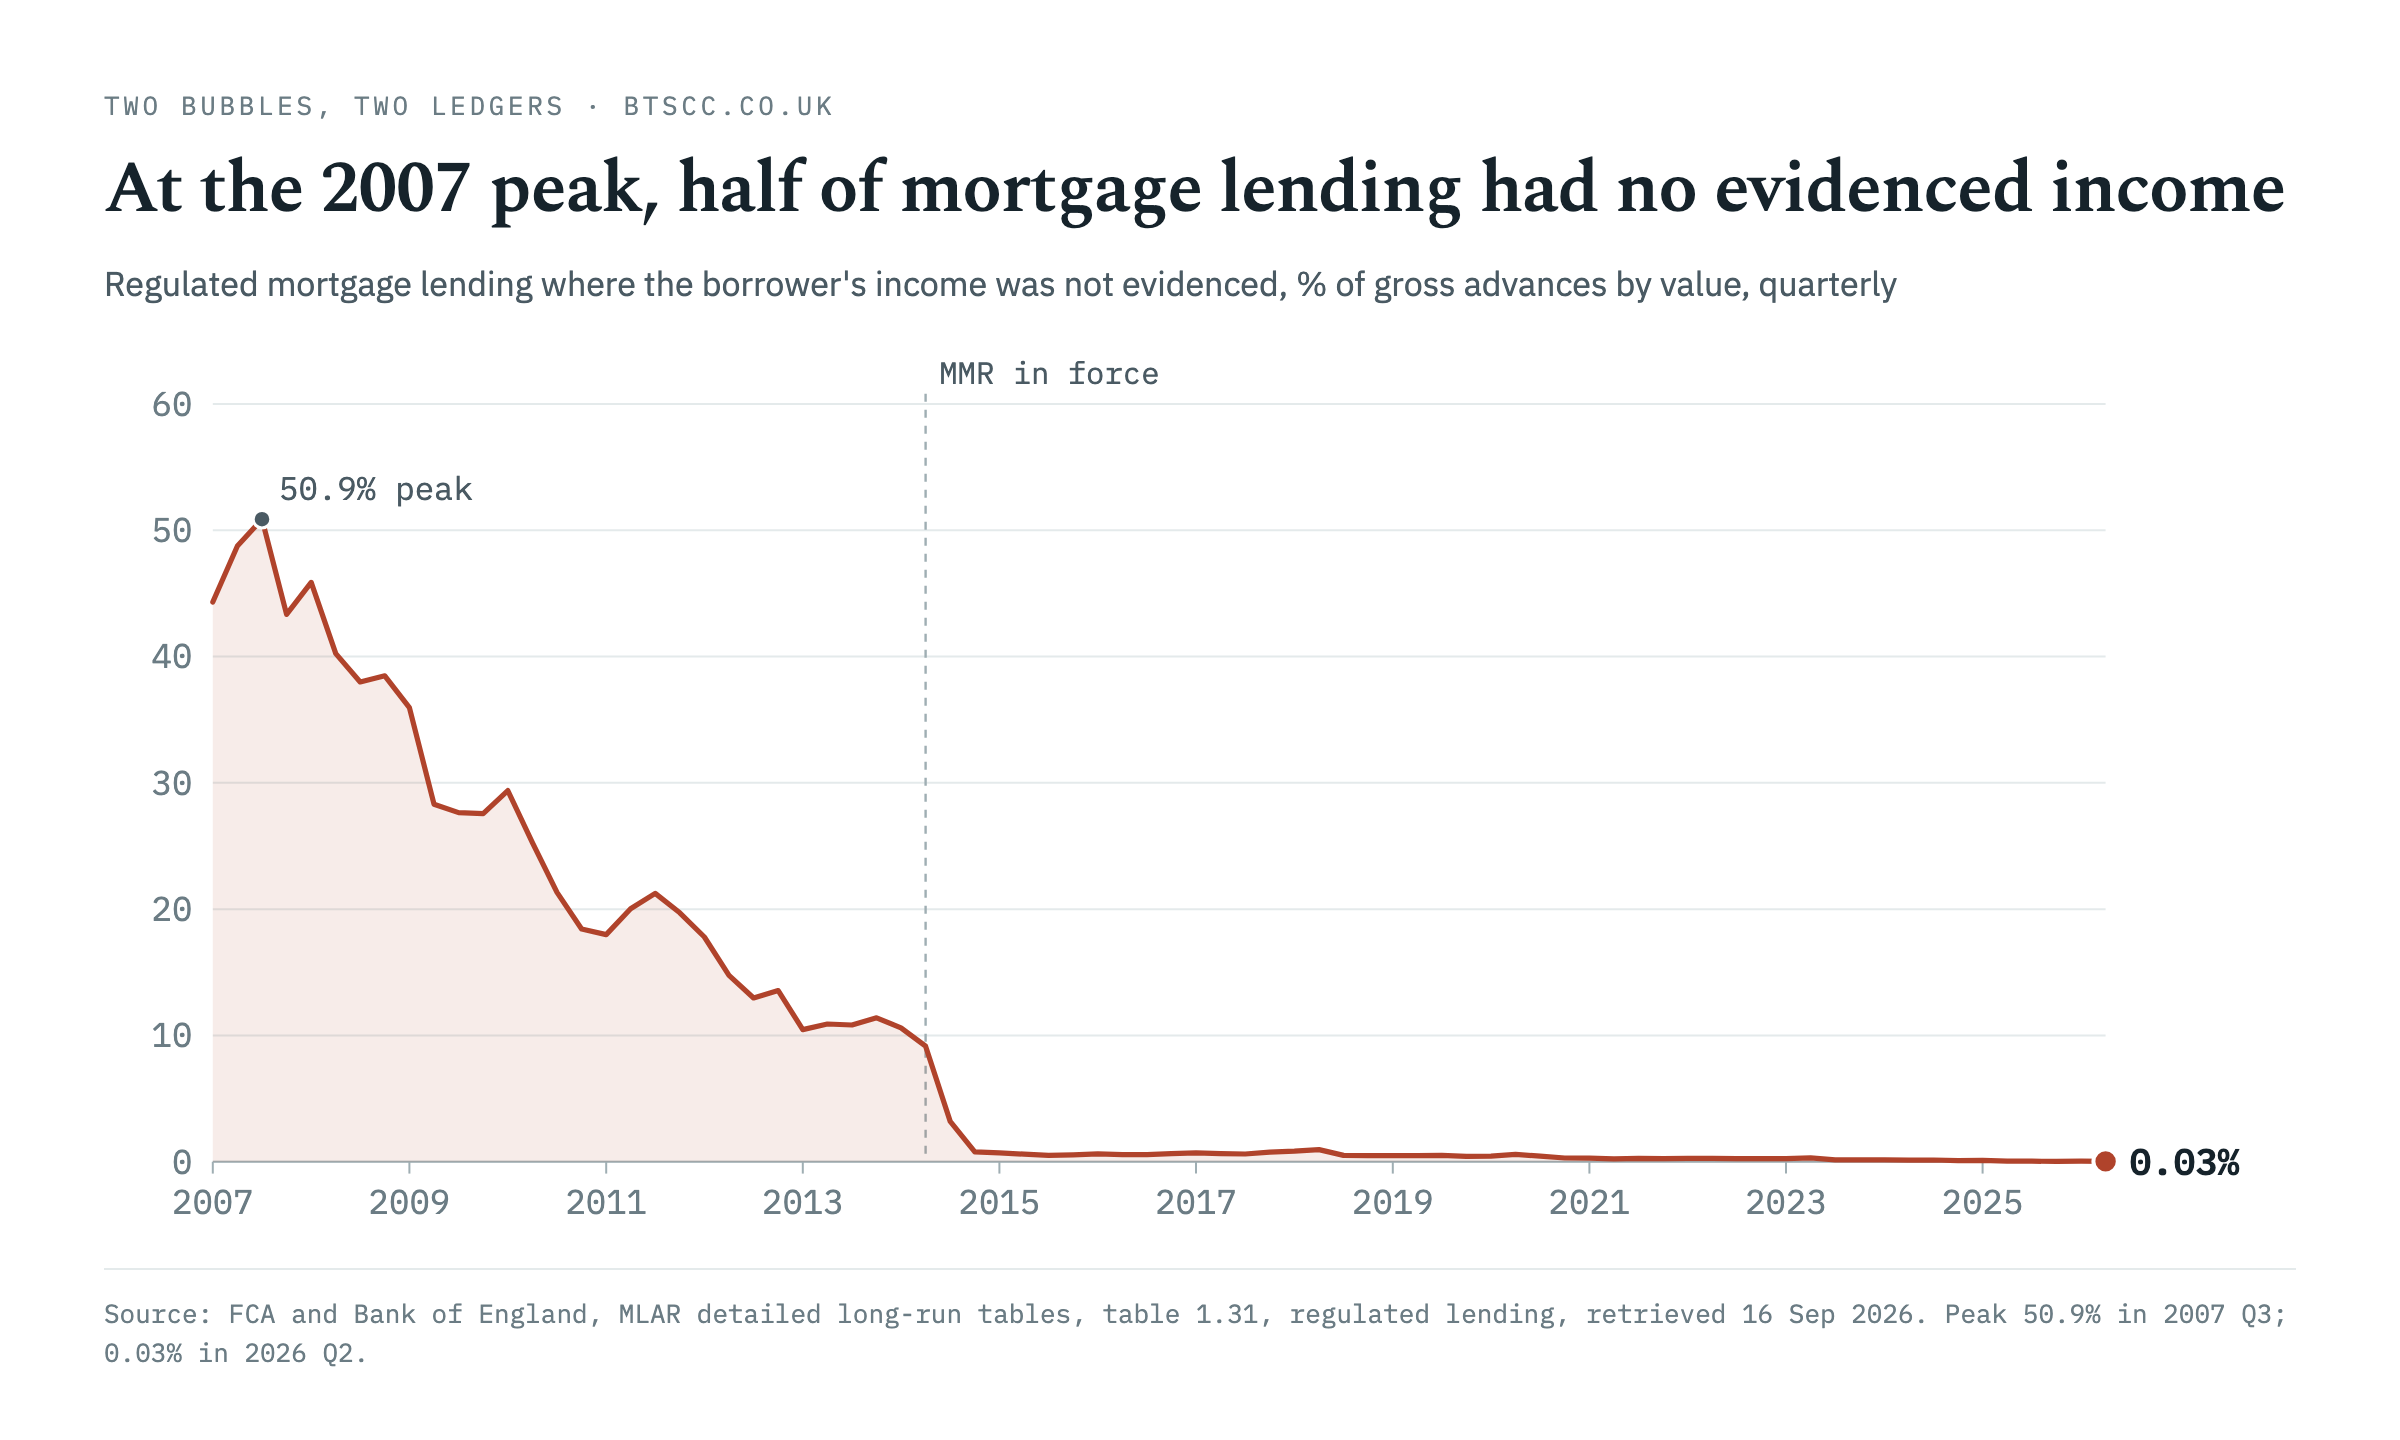
At the peak in 2007, half the money lent on UK homes went to borrowers whose income nobody had evidenced.
The number comes from the regulator’s own lending return. In the third quarter of 2007, 50.9% of regulated mortgage lending by value had no evidenced income. In the second quarter of this year it was 0.03%. The FCA’s rules now ban self-certification outright: lenders “must not accept self-certification of income”. The last sliver, about £19m of the £70.9bn lent that quarter, most likely comes from the few cases where the rules don’t demand fresh evidence, such as an existing borrower moving to a new deal with the same lender without borrowing more.
I went back to that data because of a question I keep being asked. An enormous amount of money is going into artificial intelligence, and plenty of people now use the word bubble without blinking. So is this the next 2008? And if it is, what happens to the mortgage market?
My answer, having spent rather more time with the numbers than I planned to, is that the lending that broke in 2008 has largely been taken out of UK mortgages. If the AI boom turns, I think we’d feel it through jobs and swap rates rather than through a collapse in lending. Here’s how I got there.
The lens I used belongs to Hyman Minsky, the American economist best known for his financial instability hypothesis. Minsky sorted borrowers into three kinds. Hedge borrowers can pay both interest and capital from their income. Speculative borrowers can cover the interest, but need to refinance to repay the debt. Ponzi borrowers can cover neither, and depend on asset prices rising so they can keep refinancing. His awkward insight was that long stretches of prosperity push an economy away from the first kind of borrowing and towards the last.
Run the 2007 mortgage market through that lens and it isn’t pretty. Interest-only made up 42.1% of regulated lending by value in the second quarter of 2007. When the FSA looked back, it found most of the interest-only loans sold in 2006/07 had no repayment vehicle specified, and it concluded that many had been taken out on affordability grounds. In Minsky’s language, that’s speculative borrowing sold as a way to make the numbers work.
Parts of the market went further. The FSA described firms whose business models were built around borrowers with impaired credit and equity in their homes, and which “entered the market with the expectation that a large number of their consumers would not be able to pay and would either have to remortgage or face repossession.” That’s a Ponzi model, written into the business plan.
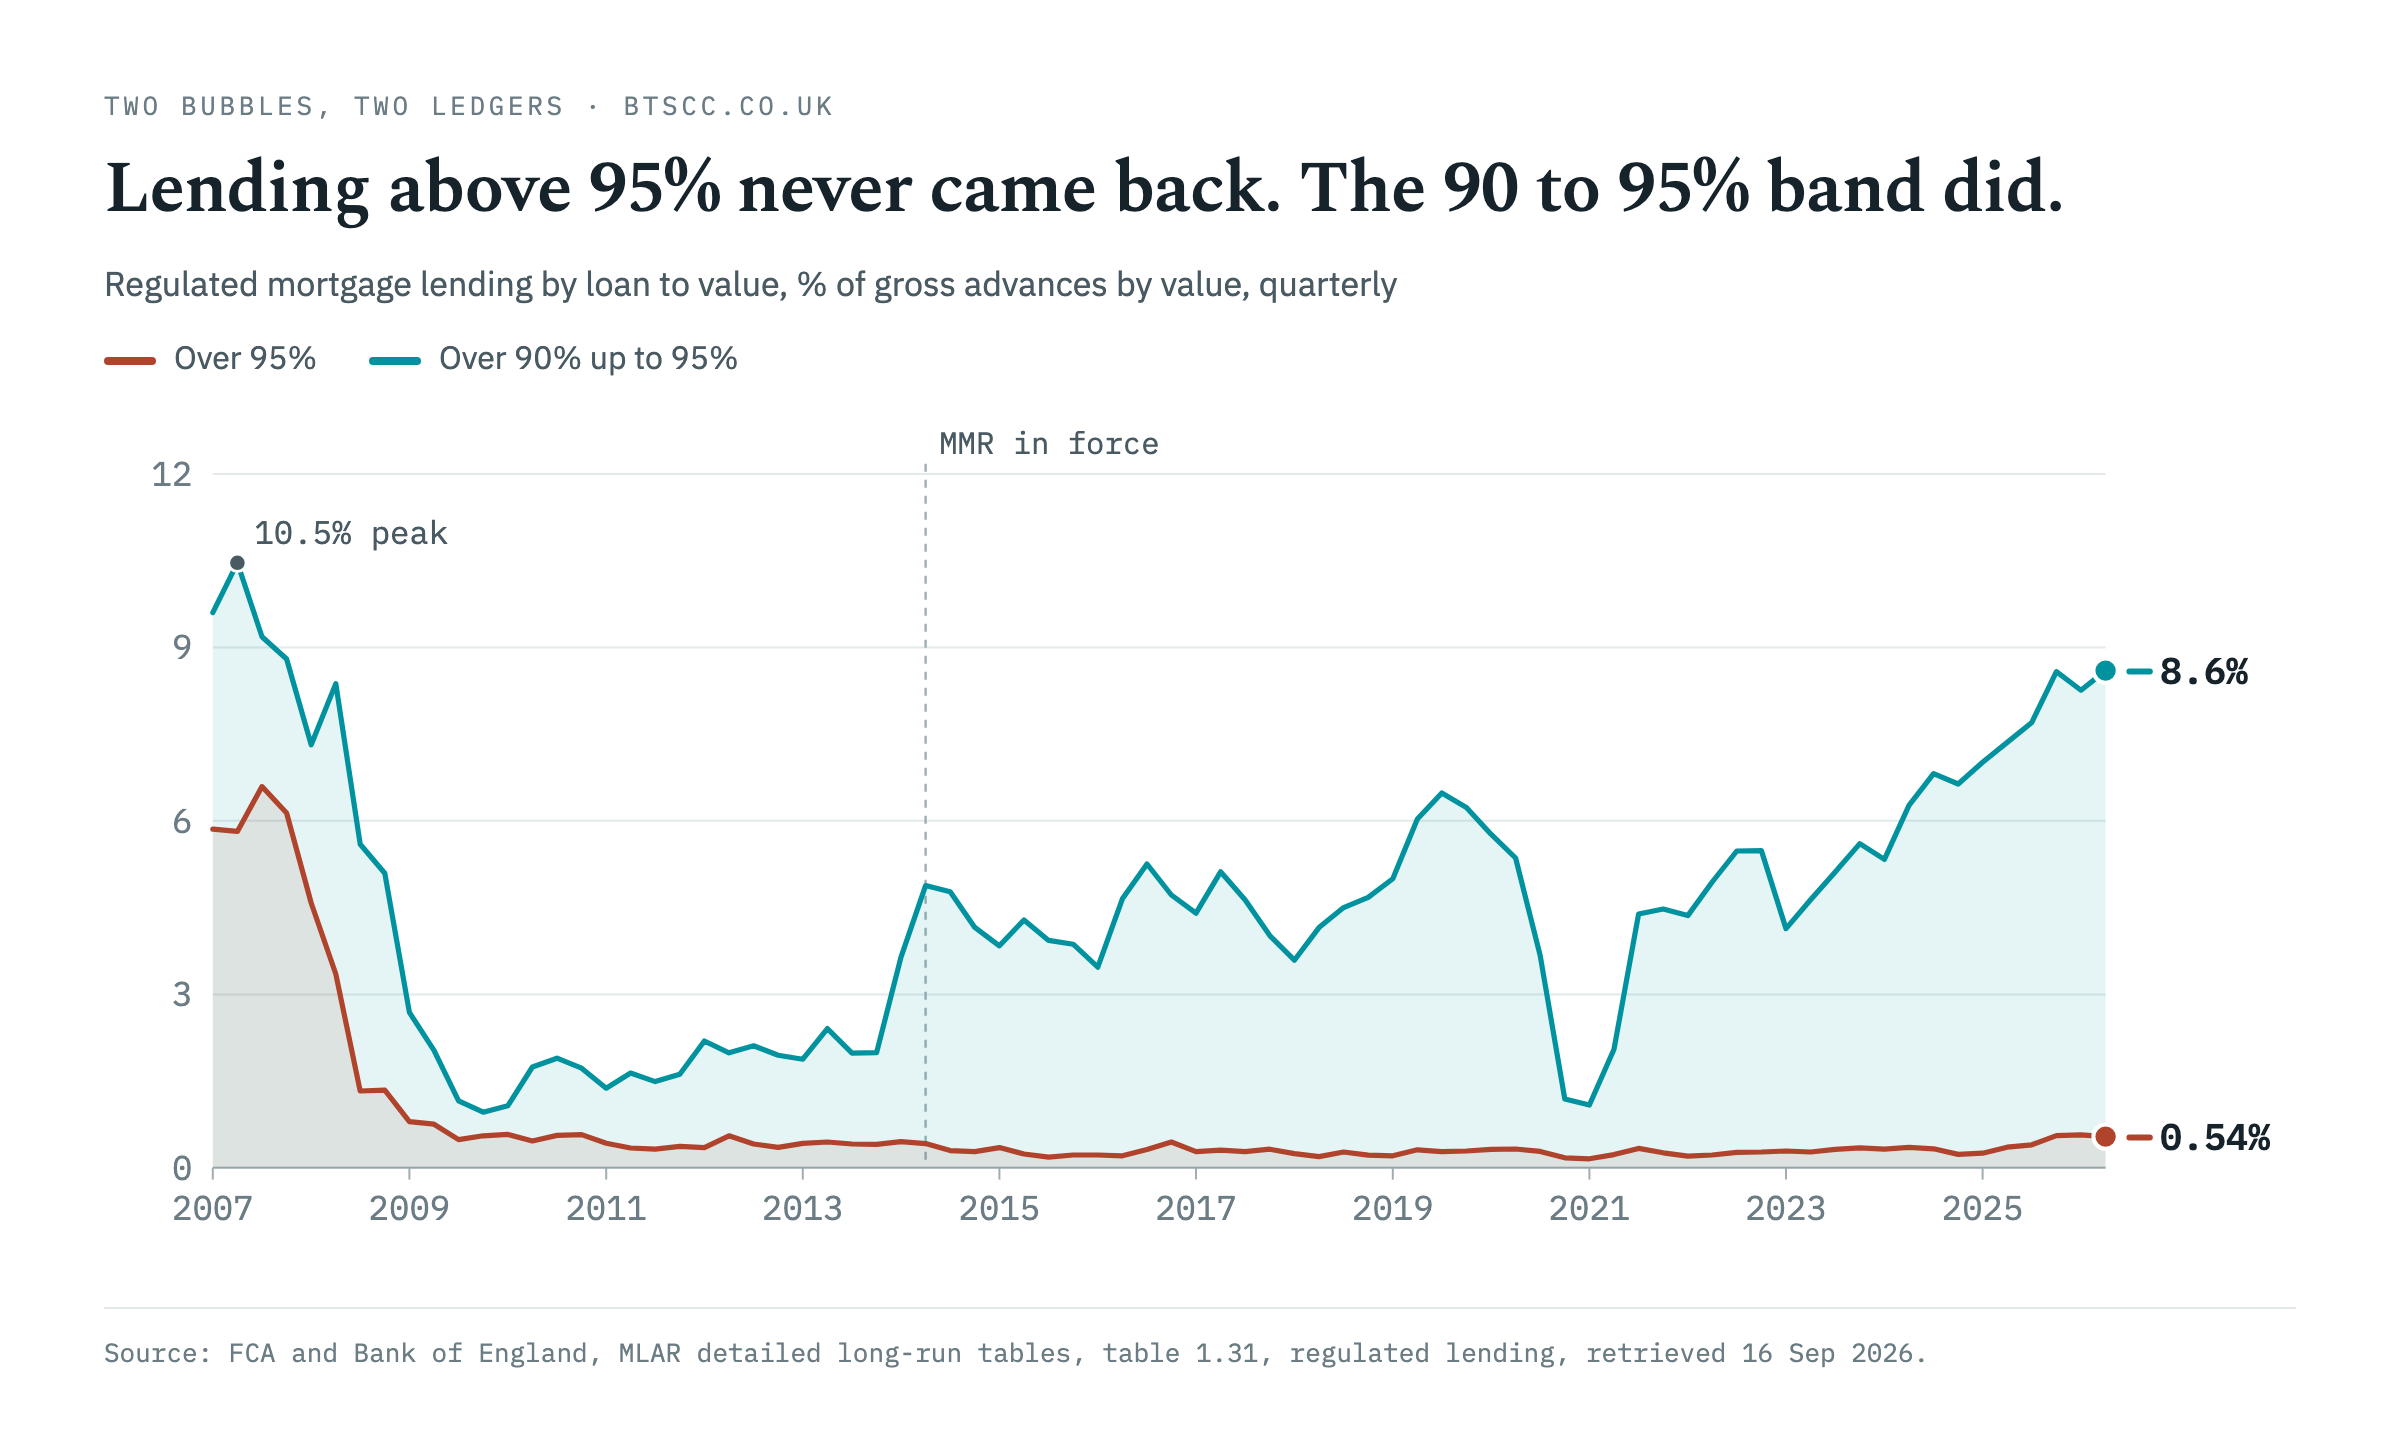
Almost all of that has gone. Lending with no evidenced income is down from half to a rounding error. Interest-only has fallen from 42.1% of lending to 7.4%. Loans above 95% of the property’s value have gone from 5.8% to 0.54%. The sharpest single break came when the Mortgage Market Review’s rules took effect in April 2014, which is when unverified income all but vanished from the data. Interest-only and 95%-plus lending had been falling since 2008.
The way lenders fund themselves has shifted too. In the second quarter of 2007, 17.6% of regulated mortgage balances had been securitised. Today the figure is 5.4%. The FSA found that passing risk on through securitisation and whole-loan sales had contributed to looser lending standards, so I’d call that a change worth having.
And when it did go wrong last time, it went wrong at scale. In the first quarter of 2009, 3.38% of regulated balances were in arrears. The latest figure is 1.03%.
Now look at the other ledger.
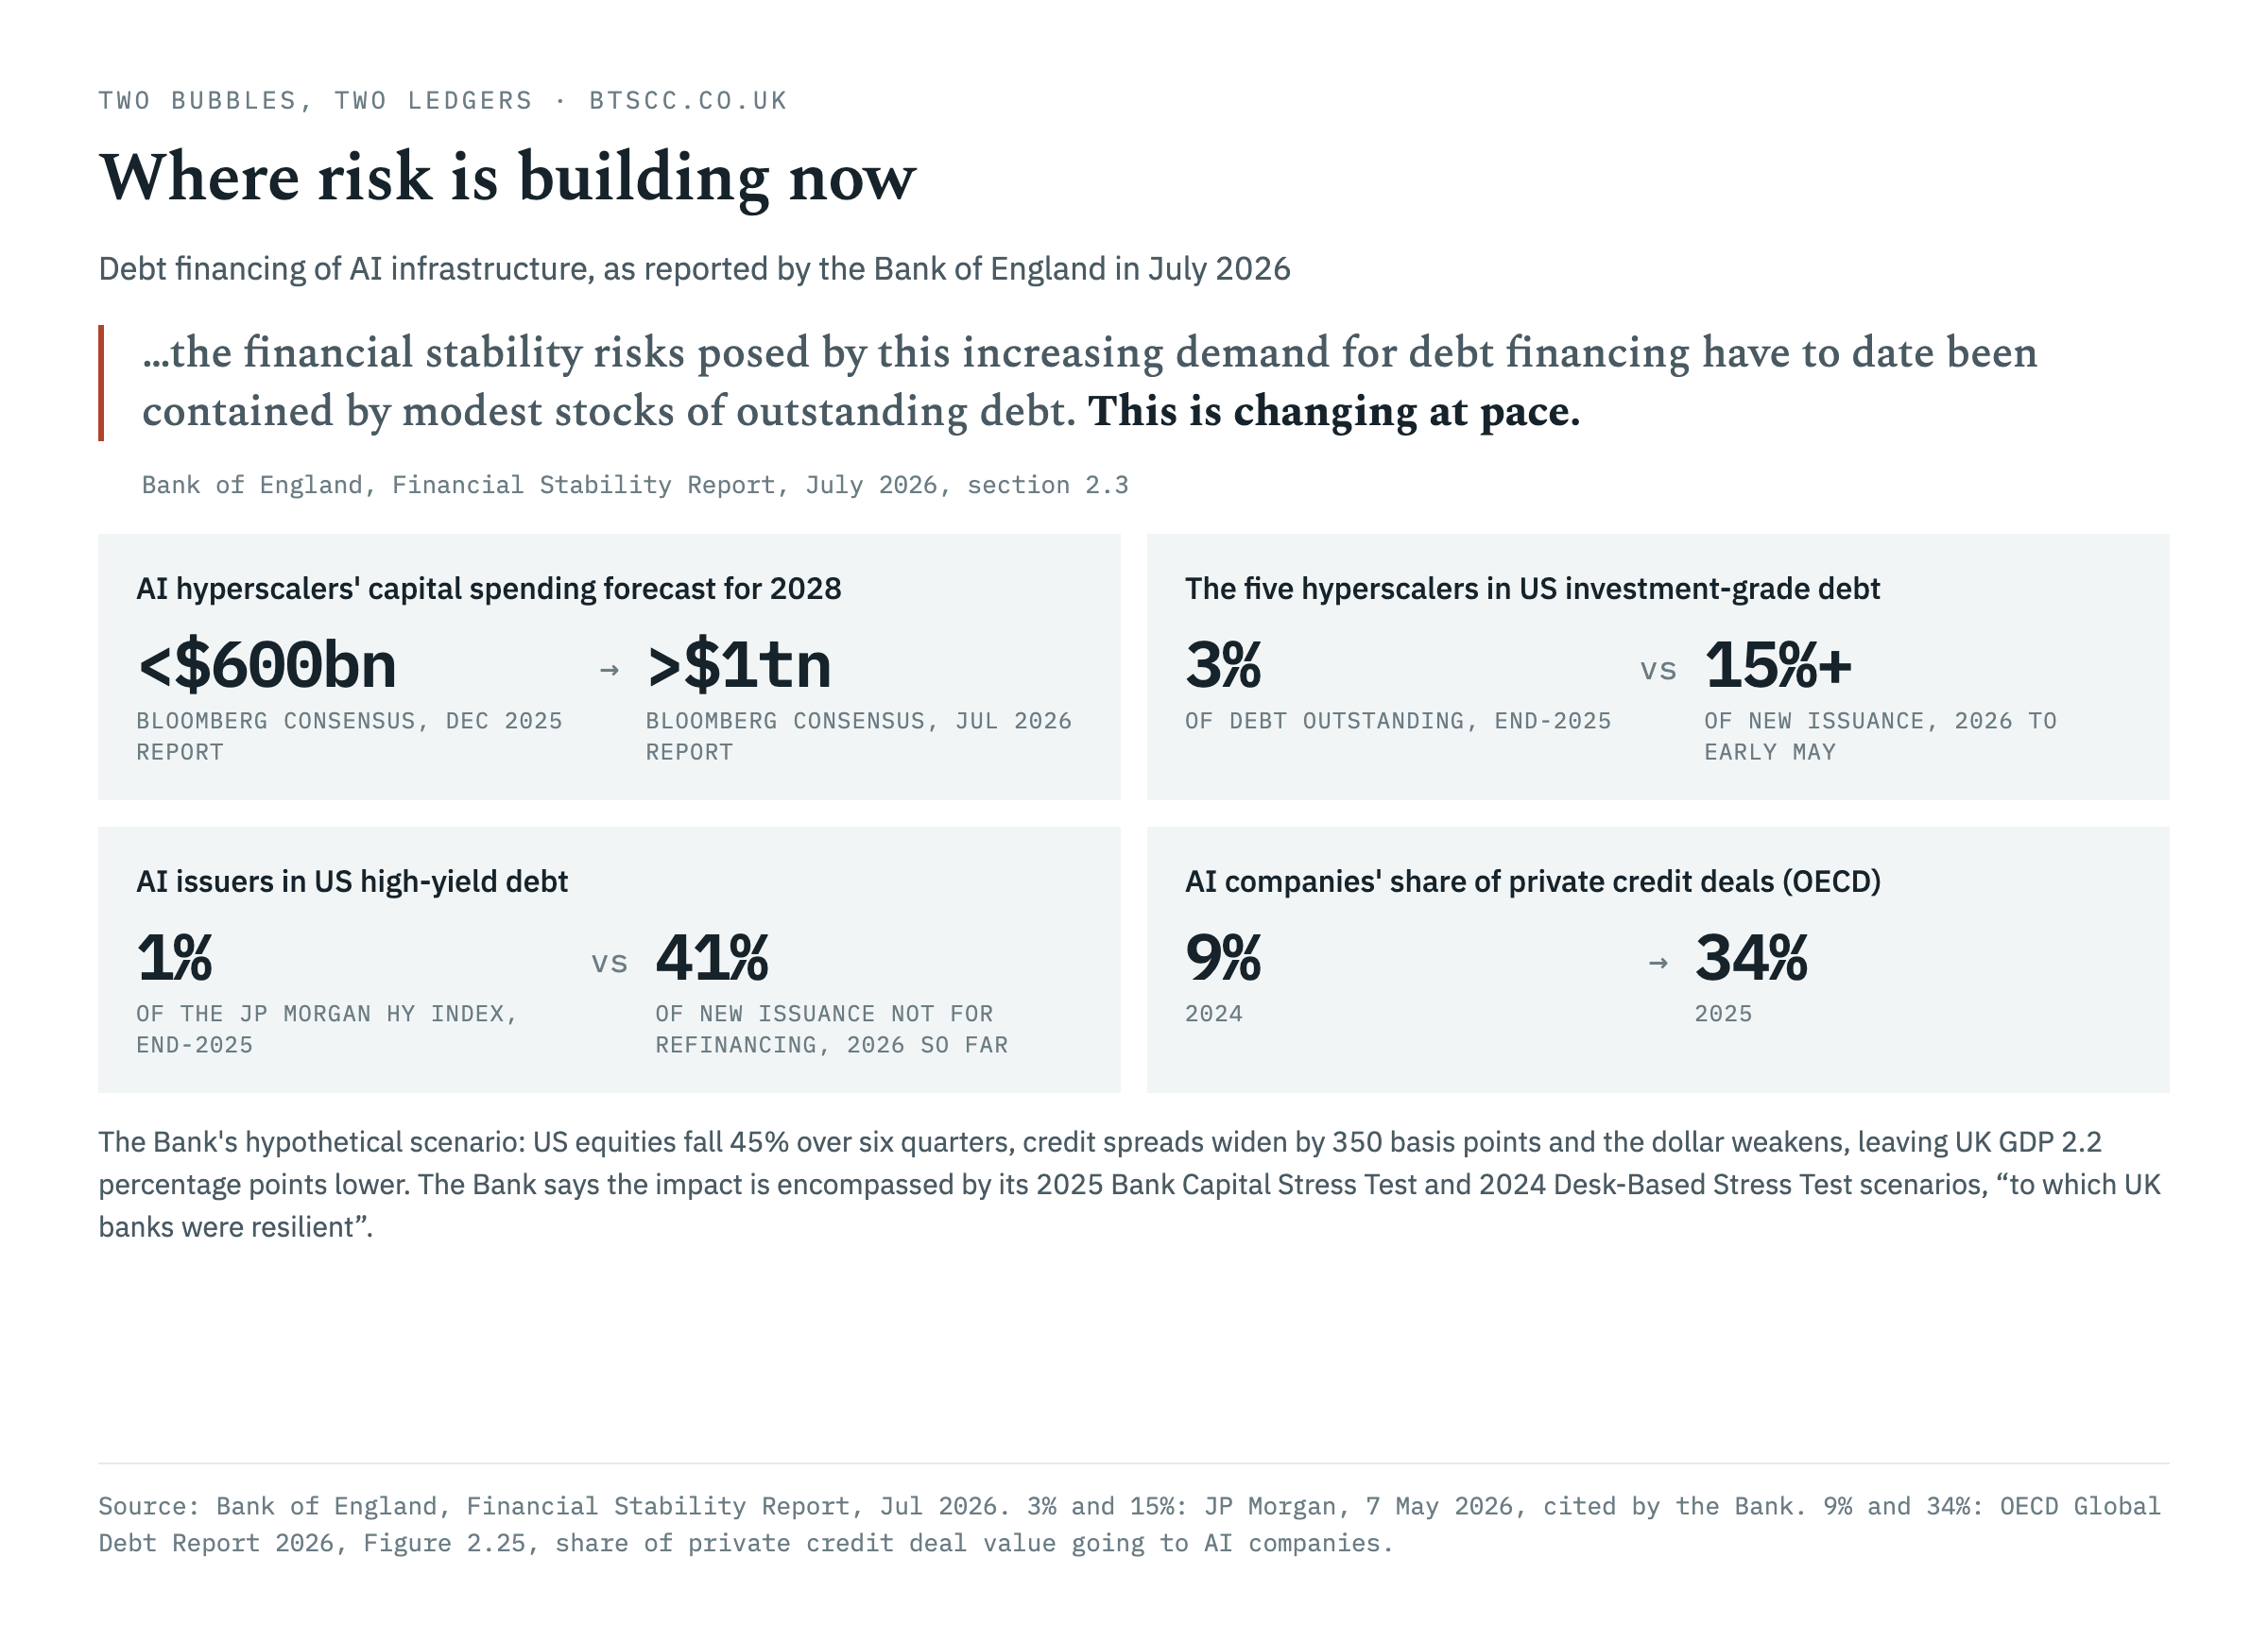
The Bank of England’s Financial Stability Report in July spends a lot of time on AI, and some of it makes sobering reading. When the Bank published its December report, the Bloomberg consensus had the big AI hyperscalers (Alphabet, Amazon, Meta, Microsoft and Oracle) spending less than $600bn on capital projects in 2028. By July the same estimate was over $1tn.
More of that is being paid for with debt. Those five companies were 3% of outstanding US investment-grade debt at the end of 2025, and more than 15% of new issuance this year up to early May. AI issuers accounted for 41% of new US high-yield issuance that wasn’t refinancing, despite being 1% of JP Morgan’s high-yield index at the end of last year. The OECD found that AI companies’ share of private credit deals jumped from 9% in 2024 to 34% in 2025.
The Bank’s own summary is that the risks from this borrowing have “to date been contained by modest stocks of outstanding debt.” Then it adds five words. “This is changing at pace.”
There’s a detail in the report that any underwriter will recognise. AI debt has tended to be long-dated, more than ten years, and most of it has funded data centre buildings. Yet the Bank notes that frontier data centres “can quickly become outdated if they are no longer able to support the latest chips.” Lending long against collateral that may not hold its value is a mistake mortgage people know well.
The differences from 2008 matter more than that echo, though. This borrowing runs through bond markets, private credit, leveraged and structured finance, and most of the five hyperscalers carry credit ratings of AA- or above. The Bank also ran a hypothetical scenario in which US shares fall 45% over six quarters, credit spreads widen by 350 basis points and the dollar weakens. UK GDP ends up 2.2 percentage points lower. The Bank says that impact sits within its 2025 and 2024 stress-test scenarios, “to which UK banks were resilient.”
So where would an AI bust reach the mortgage market? From here on this is my view rather than the Bank’s.
The first route is jobs. A hit to GDP of that size would show up in employment, and mortgage books tend to go wrong when borrowers lose income. Affordability checks stress borrowers against higher rates. A lost salary is a different kind of shock. If a market correction arrived at the same time as AI was genuinely reshaping office work, the pressure would land on the borrowers who stretched furthest.
That’s why the 90 to 95% band caught my eye. It has climbed back to 8.6% of regulated lending, close to the 10.5% it reached in 2007. Today’s borrowers in that band have had their income evidenced and their affordability tested, which puts them in a far stronger position than their 2007 equivalents. But they also have the least equity if prices soften. Lenders have more room at higher income multiples too, with a number of them taking up the PRA’s option to disapply their individual limit. Lending at 4.5 times income or more was 13.2% of new lending in the first quarter of this year, and 10.8% on the four-quarter measure that the Bank’s 15% cap applies to.
The second route is swap rates, and I honestly don’t know which way that one goes. After the conflict in the Middle East broke out, we saw how quickly lenders withdraw and reprice products when swaps move. When the Bank wrote its July report, the average two-year fix at 75% LTV was 4.92%, 72 basis points higher than at its December report. The Bank also points out that sustained AI investment can push real interest rates up. A sharp correction could just as easily send money looking for safety and pull rates down. I wouldn’t want to bet on the direction.
Minsky’s warning was that stability breeds its own risks. The mortgage market has spent the years since 2008 making sure 2007 can’t happen again, and the data shows how far lending has moved. What I keep coming back to is whether we’ve been watching the last crisis so closely that we’d miss the next one arriving through a client’s payslip.
Sources and notes
Mortgage figures: FCA and Bank of England, MLAR statistics: detailed long-run tables, retrieved 16 September 2026. All mortgage figures cover regulated lending, meaning loans on homes the borrower or their family live in, and shares of lending are by value. Arrears are balances where missed payments equal 1.5% or more of the balance, including possessions.
https://www.fca.org.uk/publication/data/mlar-statistics-detailed-long-run.xlsx
AI figures: Bank of England, Financial Stability Report, July 2026. The 3% and 15% figures come from JP Morgan, as cited by the Bank.
https://www.bankofengland.co.uk/financial-stability-report/2026/july-2026
OECD, Global Debt Report 2026, Figure 2.25.
https://www.oecd.org/en/publications/global-debt-report-2026_e9d80efd-en/full-report/corporate-debt-market-outlook-in-a-transforming-world_cf86a220.html
FSA, DP09/3 Mortgage Market Review, October 2009.
https://www.fca.org.uk/publication/discussion/fsa-dp09-03.pdf
FCA Handbook, MCOB 11.6 Responsible lending and financing.
https://www.handbook.fca.org.uk/handbook/MCOB/11/6.html
On Minsky: Mark Knell, “Schumpeter, Minsky and the financial instability hypothesis”, 2014.
Download the full chart pack (PDF): https://btscc.co.uk/wp-content/uploads/2026/09/two-bubbles-two-ledgers-chart-pack-september-2026.pdf
This article is commentary, not financial advice. It was drafted with AI assistance.